Risk Indices
Risk Indices
PIISA has integrated 10 novel piloted open-source risk indices into the Risk Data Hub of the European Commission’s Disaster Risk Management Knowledge Centre (DRMKC). The Risk Data Hub (RDH) is a pioneering platform designed to centralise and standardise risk, damage and loss data at a pan-European level. All indices developed by PIISA are found under the Hosted Projects page under PIISA and they are associated with specific climate risks in order to quantify the composite physical risk. This information can be used either for pricing or to produce hazard maps for underwriting policies, to ensure the profitability of the products, but also in terms of prevention and awareness of end-users. The novel risk indices integrated into the DRMCK’s Risk Data Hub are presented below.
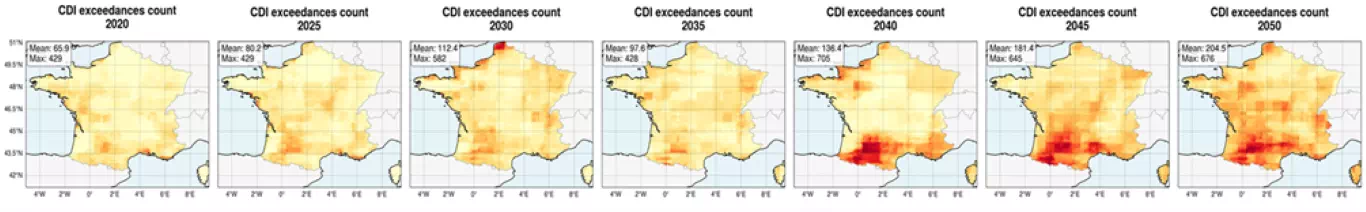
Climate Dryness Index (CDI)
The Climate Dryness Index (CDI) was developed within the PIISA project to assess the risk of clay shrink–swell (CSS) events, which can cause structural damage to buildings in areas with clay-rich soils.
To assess the CSS phenomenon, a compound index called the Climate Dryness Index (CDI) was developed. The index captures the combined effect of drought and heatwaves on soil stability risk by integrating information on precipitation deficits and high temperatures. Indeed, drought is the primary trigger for CSS events, and this can be exacerbated by the simultaneous occurrence of heatwaves. The CDI is composed of two standardised single-hazard indices: the Standardised Precipitation Index (SPI), a widely used precipitation-based index to describe drought events and their time scale, probability and intensity, and the Standardised Heatwave Index (SHI), a novel index developed by Amigo and derived as a modification of an existing heatwave index, widely adopted for monitoring heatwaves.
The index is computed using climate projection data, allowing users to explore how the frequency and intensity of such compound events may evolve under future climate conditions. The resulting maps show the spatial distribution and frequency of extreme dry and hot conditions associated with increased CSS risk.
This information can support insurers, public authorities and urban planners in identifying areas exposed to higher risk and in anticipating future changes.

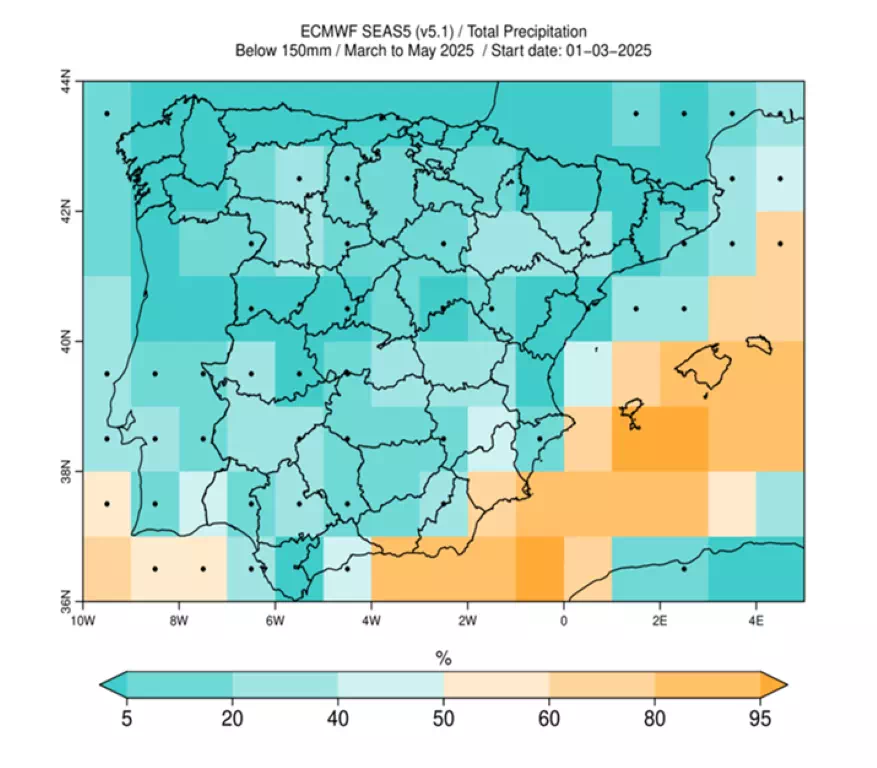
Three-Month Dry Accumulation Probability Index (DAP150)
The Three-Month Dry Accumulation Probability Index (DAP150) shows how likely it is that rainfall over three consecutive months will stay below 150 mm (i.e. meaning drier-than-usual conditions). This specific precipitation threshold has been identified in collaboration with ASAJA-Jaén, the main user of the Food and Agriculture pilot in the PIISA project. This precipitation threshold is relevant for Southern Spain, but similar indices might be computed based on relevant thresholds for other locations and users.
The map below shows low probability of having dry conditions over Southern Spain, in spring 2025, with only a few regions (southeastern Spain and the Balearic Islands) exceeding the 80% of probability of dry conditions according to the DAP150 index.
The index has been computed for the Iberian Peninsula. Two precipitation datasets have been used: the ERA5 reanalysis and the seasonal predictions — forecast of the average conditions for the next one up to six months — from the ECMWF SEAS5 seasonal prediction system.
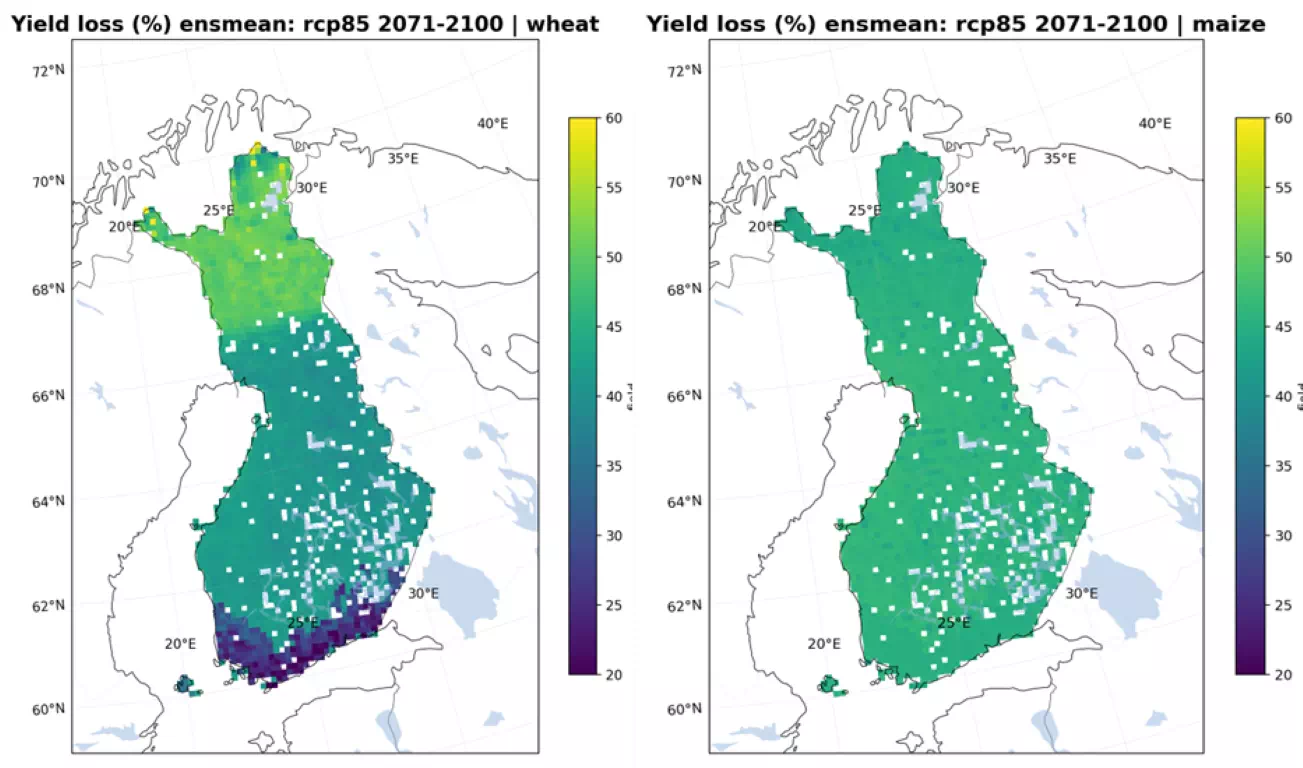
Yield loss drought index
Yield loss drought index estimates potential crop yield loss caused by water stress under rainfed conditions, assuming that irrigation is not available to compensate for precipitation deficits.
The approach is based on established FAO crop water balance methodology. First, the reference evapotranspiration (ET₀) is calculated using the FAO Penman–Monteith equation. Crop evapotranspiration demand is then estimated using crop-specific coefficients.
This indicator represents the projected percentage of crop yield loss under rainfed conditions, derived solely from climate model simulations. It should be interpreted as a what-if scenario: if a specific crop were grown in a given region without irrigation, the map indicates the expected yield reduction due to water stress under the projected climate conditions. Importantly, this indicator does not account for current crop distribution, management practices, or actual cultivated areas. Instead, it provides a climate-driven estimate of potential yield loss assuming that the crop is grown in that location under rainfed conditions.
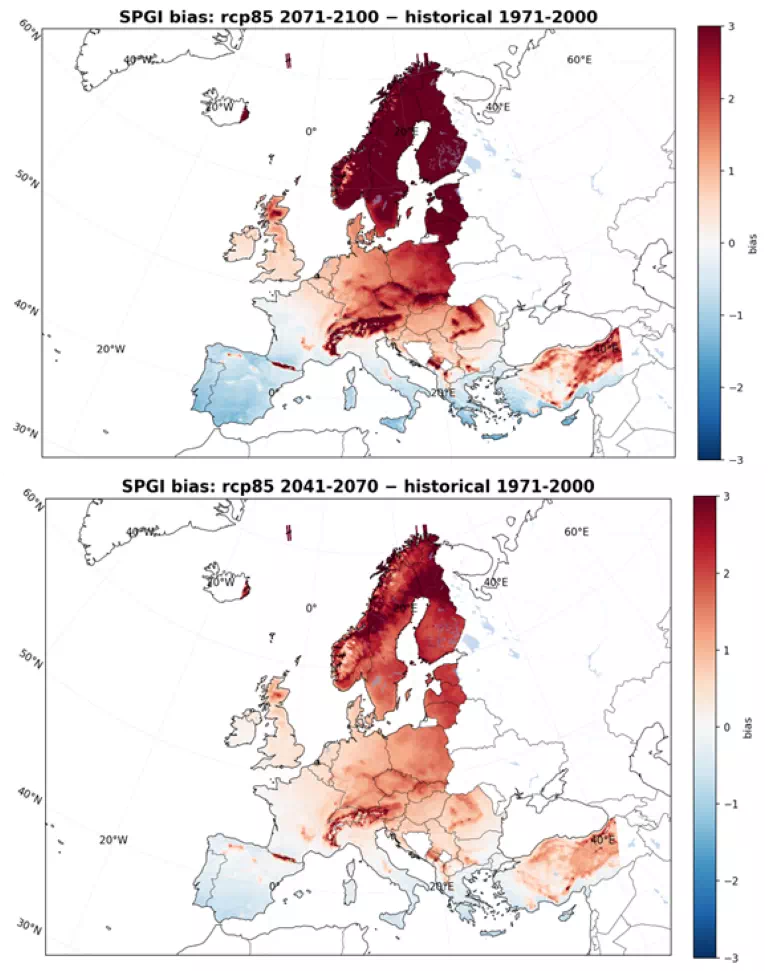
Standardized Precipitation and Growth Index (SPGI)
The Standardized Precipitation and Growth Index (SPGI) is designed to evaluate drought conditions during the period most critical for vegetation and crop development. Unlike traditional precipitation-based drought indices, SPGI explicitly accounts for the timing and duration of the growing season, ensuring that precipitation anomalies are assessed during the biologically relevant period for plant growth.
The index was developed within the PIISA project in collaboration with agricultural insurance partners, with the aim of supporting climate risk assessment and decision-making in agricultural systems. It is calculated by standardizing precipitation accumulated during the growing season relative to its long-term climatology.
Because the index is standardized, positive SPGI values indicate wetter-than-normal growing seasons, while negative values indicate increased drought risk during the crop growth period; values between −1 and 1 represent near-normal conditions, 1 to 2 moderately wet conditions, greater than 2 extremely wet conditions, −1 to −2 moderately dry conditions, and below −2 extremely dry conditions, which may correspond to severe drought impacts on crops and ecosystems.
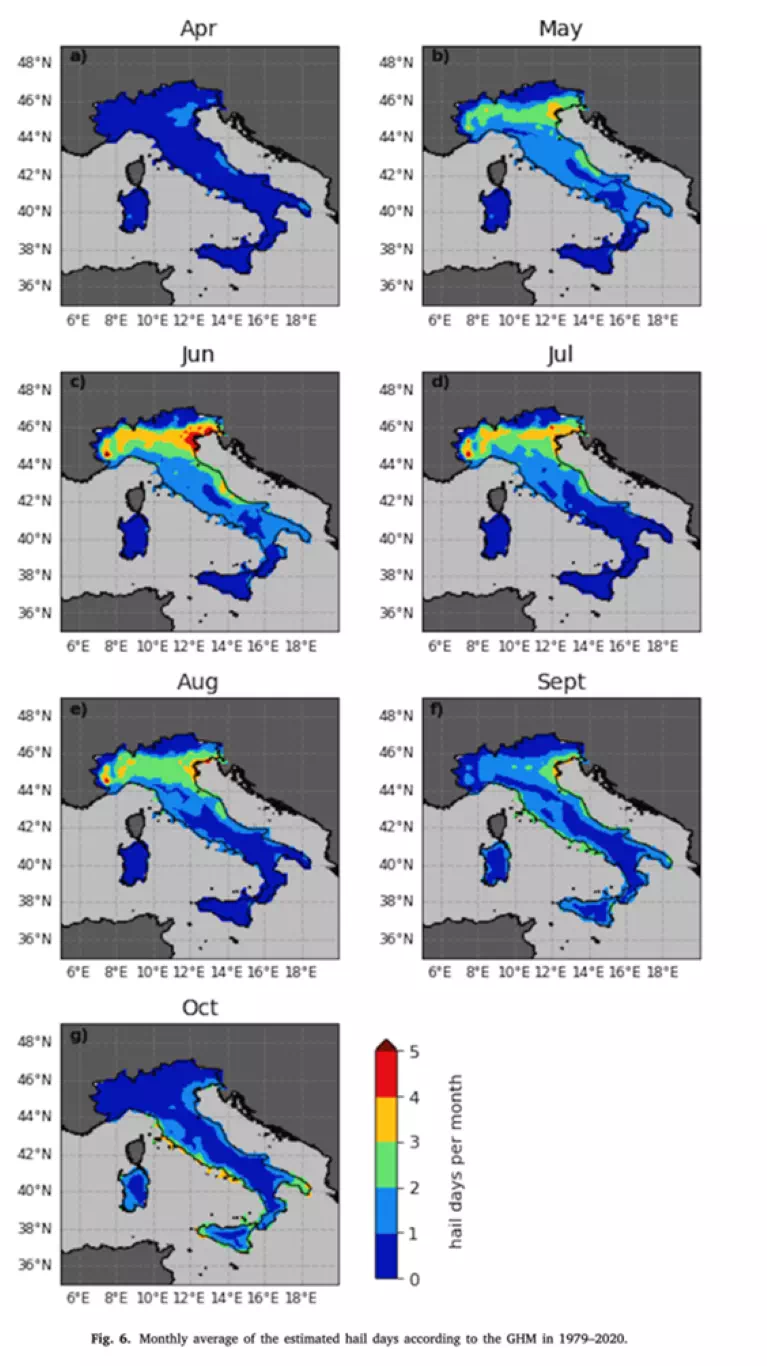
Hail index
The Hail Index provides information on the probability of hail events and their potential impact on a given region. The index is based on historical climate data and large-scale atmospheric conditions that are known to favour hail formation. These relationships are modelled using statistical or machine learning approaches and validated against available observations. The resulting maps show the spatial distribution and frequency of hail-prone conditions, helping users identify areas with higher exposure to hail risk.
This information can support insurers, farmers and risk analysts in assessing potential damage to crops and assets. The methodology can be extended to other regions by calibrating the model with local climate data and observations.
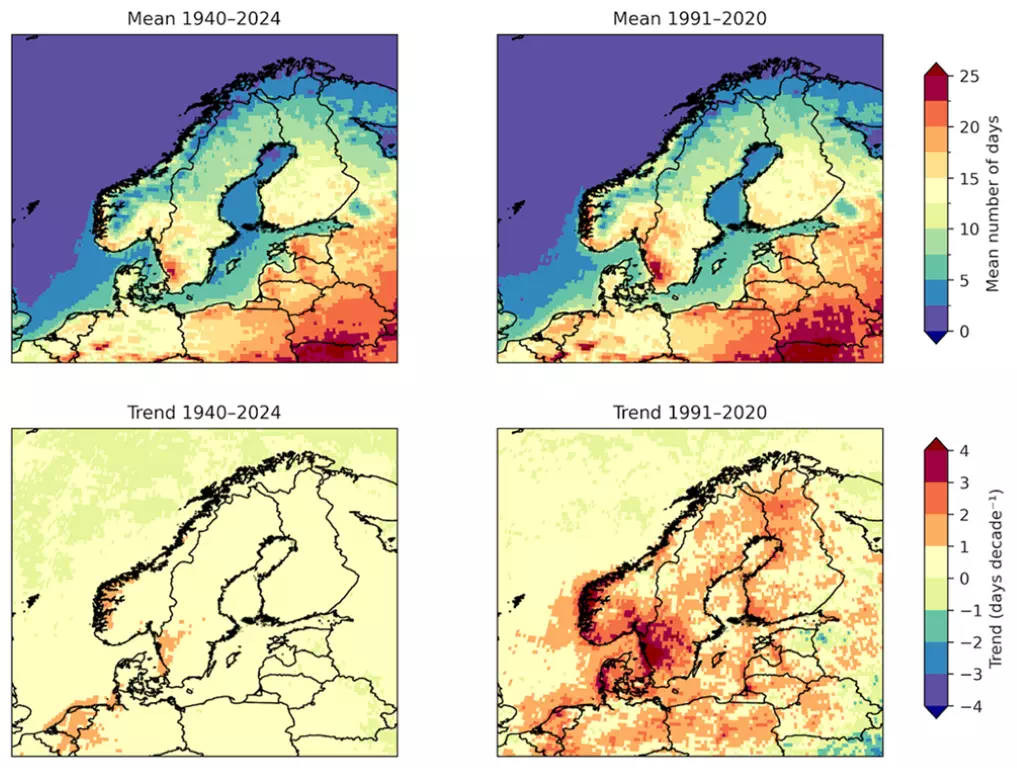
Thunder day index
The thunder day index provides estimates for the potential occurrence of a thunderstorm to enable assessment of past occurrences and trends in thunderstorm-related hazards. The index combines precipitation and atmospheric conditions favorable to thunderstorm development and is calculated from long-term reanalysis data as a proxy for a thunder day occurrence.
The resulting maps show the mean number of thunder days in May–September and its long-term trend in Fennoscandia. Since the information is based on a simple threshold-based index, it could potentially be computed also for other regions in the future. The index provides insights for many sectors assessing their adaptation needs. For instance, this information can support the forestry sector, as thunderstorms can damage forests through lightning and strong wind gusts.
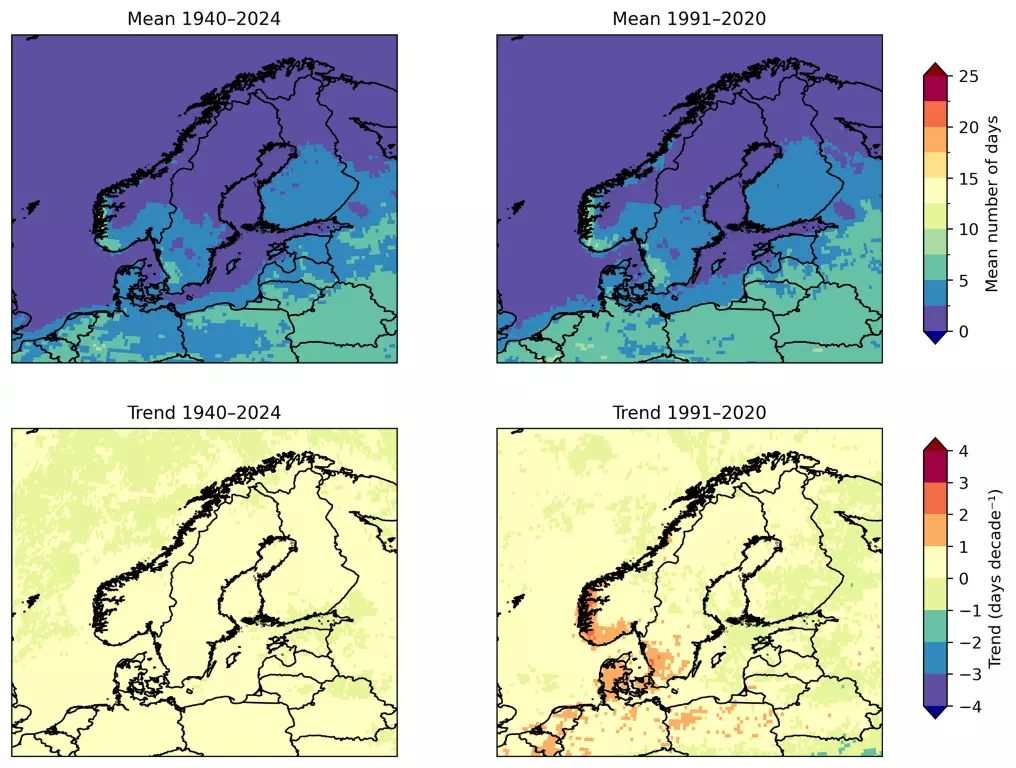
Severe thunder day index
The severe thunder day index provides estimates for the potential occurrence of a severe thunderstorm to enable assessment of past occurrences and trends in thunderstorm-related hazards. The severe thunder day index is based on the thunder day index (see above), but includes additional atmospheric conditions supportive of long-lasting, severe thunderstorms.
The resulting maps show the mean number of severe thunder days in May–September and its long-term trend in Fennoscandia. Since the information is based on a simple threshold-based index, it could potentially be computed also for other regions in the future. The index provides insights for many sectors assessing their adaptation needs. For instance, this information can support the forestry sector, as thunderstorms can damage forests through lightning and strong wind gusts.
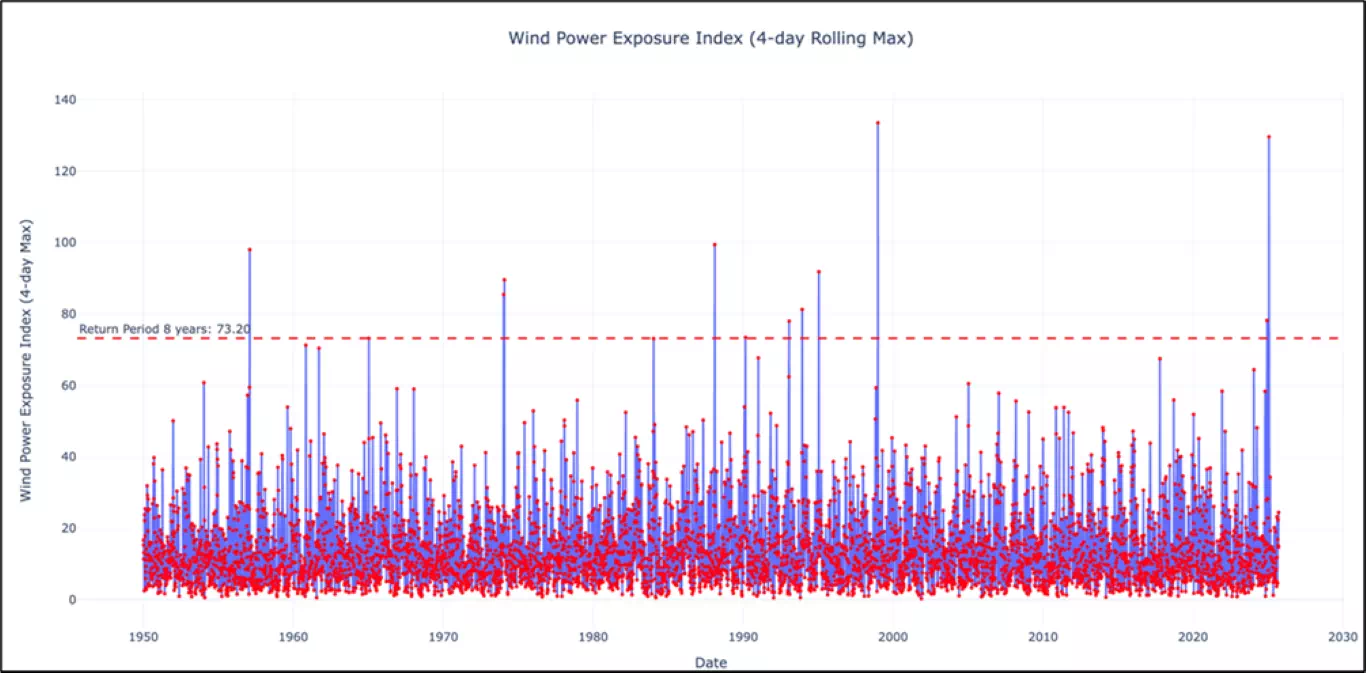
Wind Power Exposure Index (WPEI)
The Wind Power Exposure Index (WPEI) was developed within the PIISA project to estimate the potential impact of windstorms on forest assets.
The index combines information on wind speed, wind direction, and storm duration to provide a proxy for windstorm intensity and its potential to cause damage. It is based on long-term reanalysis data, allowing for a robust assessment of historical windstorm behaviour. The maps produced from the index show areas with higher exposure to damaging wind events. When combined with vulnerability functions, the index can be used to estimate expected damage levels.
This information can support forest managers and insurers in assessing wind-related risks and designing risk transfer solutions.
Standardized Windstorm Index (SWI)
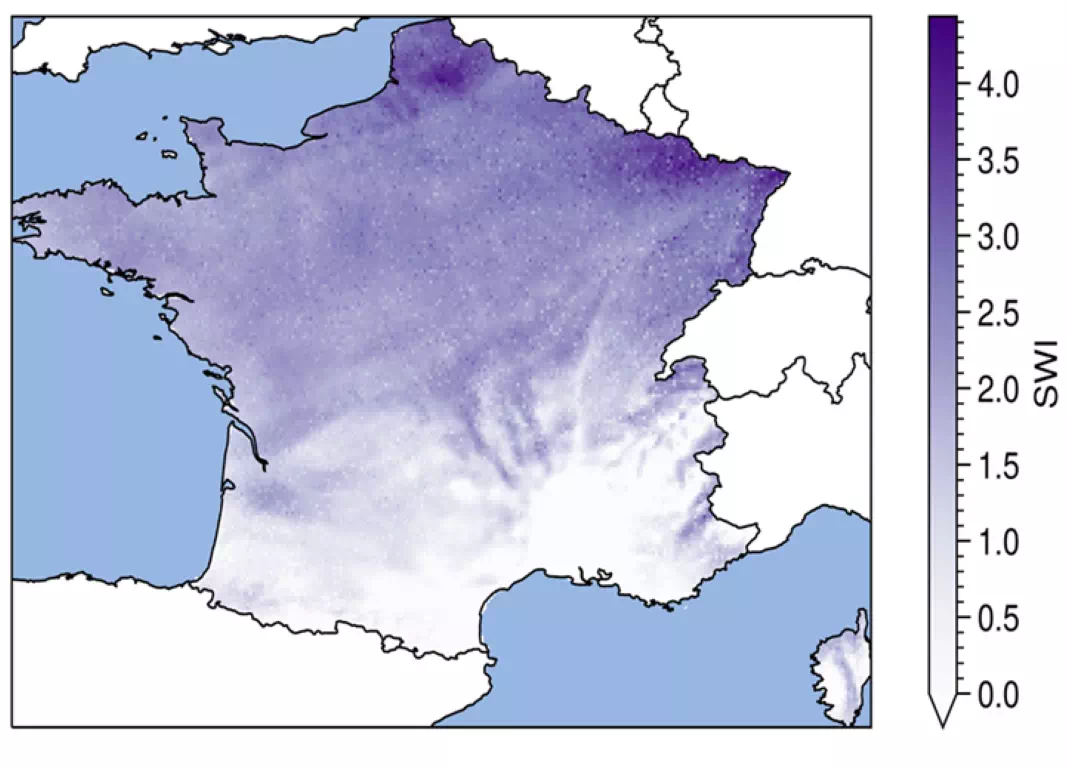
The Standardized Windstorm Index (SWI) was developed to identify and characterise severe windstorm events and their potential impacts.
The index is based on wind speed data, with higher wind speeds contributing disproportionately to the index values, reflecting their greater potential to cause damage. It allows the mapping of storm footprints and the identification of extreme wind events.
The resulting maps show the spatial extent and intensity of windstorms, providing valuable information on areas most exposed to severe wind hazards.
This information can support risk modelling and the design of insurance products, including parametric solutions. Although not directly implemented in the pilot workflows, the SWI offers strong potential for future integration into underwriting and portfolio risk monitoring. If provided at a seasonal time scale, it can support forestry operations such as planning of salvage capacity and thinning delaying.
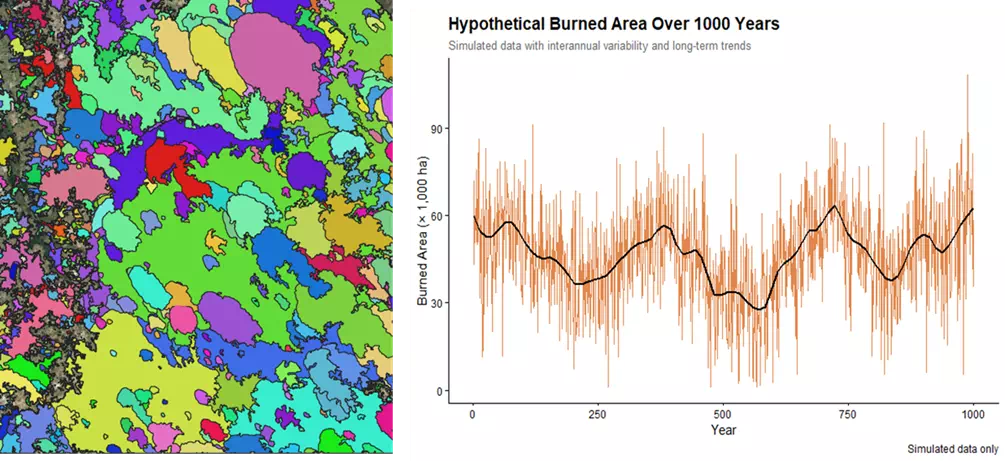
Catalogue of Stochastic Wildfire Simulations
The Catalogue of Stochastic Wildfire Simulations was developed within the PIISA project to provide a probabilistic representation of wildfire risk.
The approach combines historical wildfire data, climate information and vegetation characteristics to simulate a large number of potential fire events. These simulations represent a wide range of possible scenarios, extending beyond the historical record.
The resulting datasets and maps show the likelihood, spatial distribution and potential extent of wildfire events under different conditions.
This information can support risk assessment, forest management and insurance applications by enabling the estimation of potential damage under a wide range of scenarios. The methodology can be transferred to other regions by incorporating locally relevant data on climate, vegetation and fire occurrence.